This Tableau dashboard offers a comprehensive analysis of the sales performance for a superstore, visualizing revenue trends, sales quantity, and top-performing states and customers over a four-year period (2014-2017). The dashboard provides a clear, data-driven view of key metrics that inform business strategy and decision-making.
Project Overview
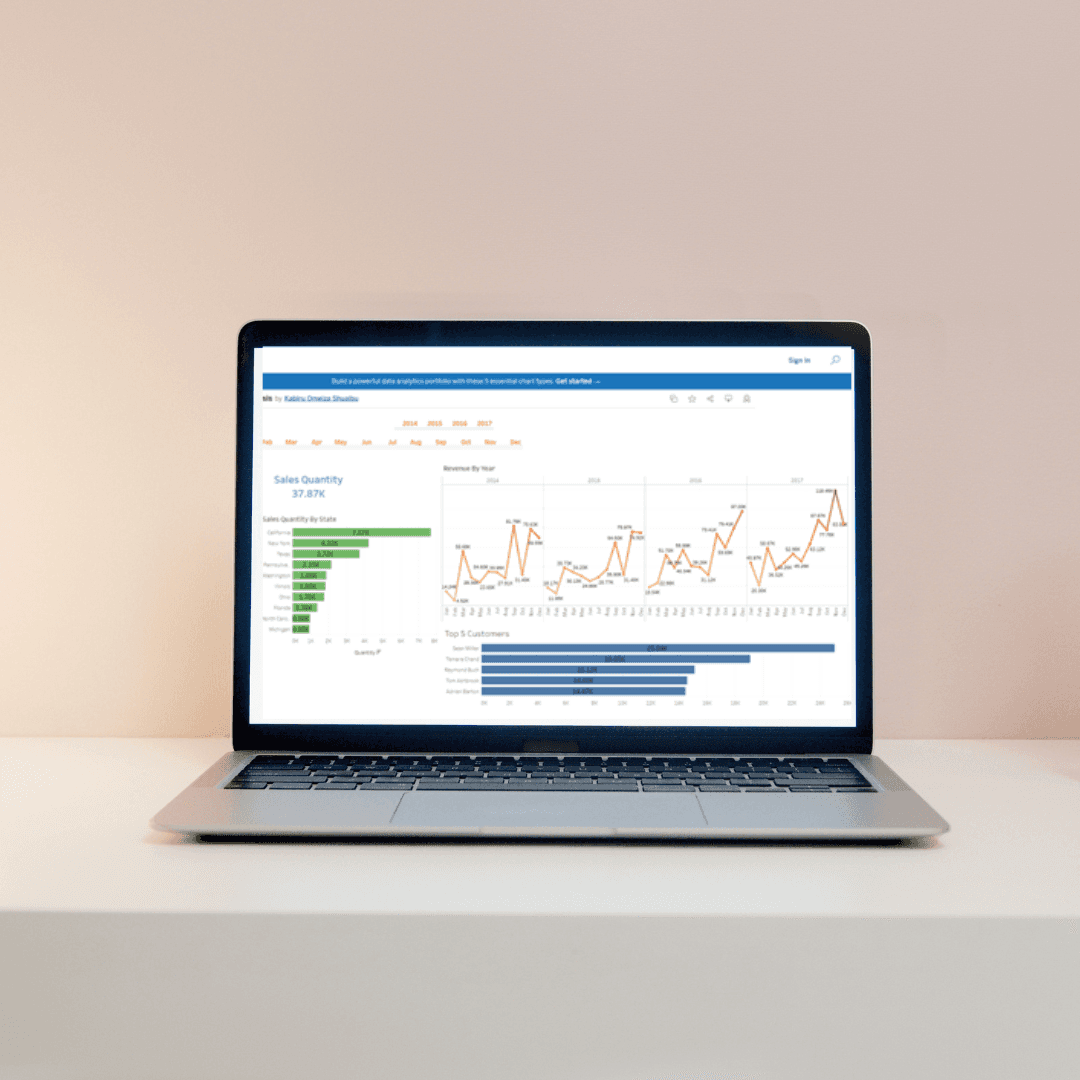
The dashboard displays the total revenue, sales quantity, and other key performance indicators for a superstore, segmented by state and customer. By using line charts, bar graphs, and visual comparisons, this dashboard highlights the store's top contributors to revenue and product quantity sales. It allows business stakeholders to assess the performance of different regions and track revenue growth over time, making it a powerful tool for strategic planning.
Key Features
Overall Metrics:
Total Revenue: $2,297.20K
Total Sales Quantity: 37.87K units These figures provide a high-level summary of the store's sales performance.
Revenue by State:
Top 5 states contributing to the store's revenue:
California: $457.69K
New York: $310.89K
Texas: $170.19K
Washington: $138.64K
Pennsylvania: $116.51K These states are visualized in a bar chart, showing their relative contribution to overall revenue.
Sales Quantity by State:
The top 5 states by sales quantity:
California: 7.67K units
New York: 4.22K units
Texas: 3.72K units
Pennsylvania: 2.15K units
Washington: 1.88K units This data highlights the states with the highest product movement, making it easy to see where the most units are being sold.
Revenue Trends by Year:
A line graph tracks revenue from 2014 to 2017, showcasing an overall upward trend, with noticeable revenue peaks in 2017.
The graph shows significant fluctuations throughout each year, providing insights into seasonal or periodic sales changes.
Top 5 Customers:
A bar chart identifies the top 5 customers based on revenue:
Sean Miller: $25.04K
Tamara Chand: $19.05K
Raymond Buch: $15.12K
Tom Ashbrook: $14.60K
Adrian Barton: $14.47K This section gives visibility into key customer accounts that drive substantial revenue for the store.
Time Period:
The dashboard spans four years, from 2014 to 2017, with the ability to filter by month, allowing users to track trends over time and across specific periods.
Challenges and Solutions
Data Segmentation: Dividing the data into state-wise and customer-wise segments helped present a clear picture of regional and customer contributions to revenue and sales.
Time-Based Trends: Visualizing the year-on-year revenue trends and monthly breakdowns made it easier to identify seasonality and sales fluctuations, providing insights into business cycles.
Final Deliverables
Interactive Tableau Dashboard: The dashboard allows users to explore sales data by state, year, and customer. Users can interact with the charts to filter the data based on specific time frames or regions.
Sales Insights: The dashboard identifies top-performing states and customers, allowing business leaders to focus on regions and accounts driving the most revenue.
Trend Analysis: The line graph tracking revenue by year offers an intuitive view of sales growth over time, helping in forecasting and strategic planning.
Conclusion
This Tableau dashboard provides an in-depth analysis of superstore sales, helping stakeholders quickly identify top regions, customers, and revenue trends. The visualizations make it easy to compare states and track sales performance over time, enabling more informed business decisions and optimized sales strategies.
Tableau File Link: Download Here