This project features an advanced Retail Sales Dashboard created in Excel, designed to deliver a complete overview of sales performance across multiple metrics such as product categories, regions, and customer segments. The dashboard was developed as part of a training initiative where 30 participants were offered free access to a course on dashboard creation, taking them through the entire process from raw data cleaning to final visualizations.
Project Overview
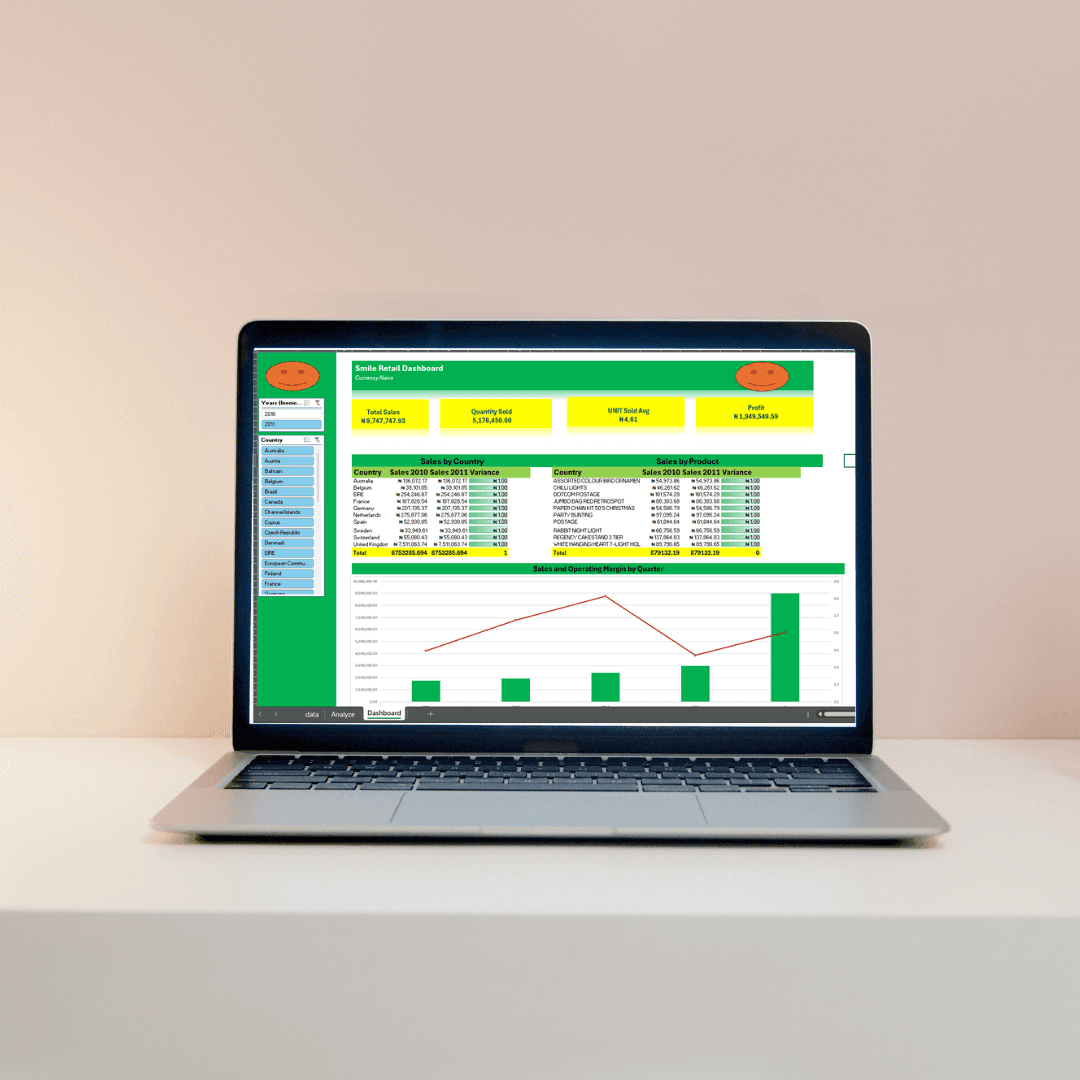
This dashboard provides a dynamic visual representation of retail sales data, offering insights into both current and historical sales performance. Using Excel's powerful analytics and visualization tools, I transformed raw sales data into a user-friendly interface that highlights key performance indicators such as sales growth, product performance, and regional sales trends. The dashboard is not only a powerful analytical tool but also a learning project designed to empower others with the skills to build similar solutions.
Key Features
Dynamic Data Visualization: Real-time sales trends and comparisons are illustrated using line and bar charts, making it easy to monitor growth and performance over time.
Sales by Product Category: Insightful breakdowns of product category sales, showing substantial growth in technology items like copiers (up by 234.5%) and strong performance in office supplies.
Regional Analysis: Highlighting city-level sales data, with standout performance in cities like San Francisco (1412.2% growth) and Providence (107.5% growth).
Year-Over-Year Comparison: A detailed comparison between 2023 and 2024 sales, showing an overall 10% increase in sales but a 55% drop in profit margins, guiding strategic adjustments.
Challenges and Solutions
Data Complexity: The initial data included multiple columns such as order date, product name, and customer details. The data was cleaned and consolidated to ensure accuracy and relevance before creating meaningful visualizations.
Performance Analysis: One key challenge was to visualize year-over-year performance for different regions and products. Using Excel pivot tables, I developed dynamic filters and slicers, allowing users to explore trends across various categories.
Training Initiative: A central component of this project was offering free dashboard training to 30 participants. The training covered everything from data cleaning, analysis, and visualization, ensuring that participants could build similar tools independently.
Impact and Results
Sales Growth: The dashboard reveals a 32% growth in total sales from ₦226,364.18 in 2023 to ₦271,730.81 in 2024. This is paired with a modest profit increase of 8%, demonstrating the need for margin optimization.
Product and Regional Insights: Product categories such as phones and accessories were among the top performers, while regions like New York City and Seattle saw significant sales surges of 202.8% and 176.4%, respectively.
Strategic Decision-Making: With quarterly sales and profit trends displayed visually, the dashboard enables stakeholders to make data-driven decisions by identifying high-performing products and regions, as well as underperforming areas that require attention.
Conclusion
The Retail Sales Dashboard serves as both a powerful tool for retail managers and a learning resource for aspiring data analysts. By providing clear insights into sales trends, product performance, and regional market variations, the dashboard helps businesses make informed decisions and optimize their strategies for future growth. The training session added significant value by equipping 30 individuals with the skills to develop their own dynamic dashboards.