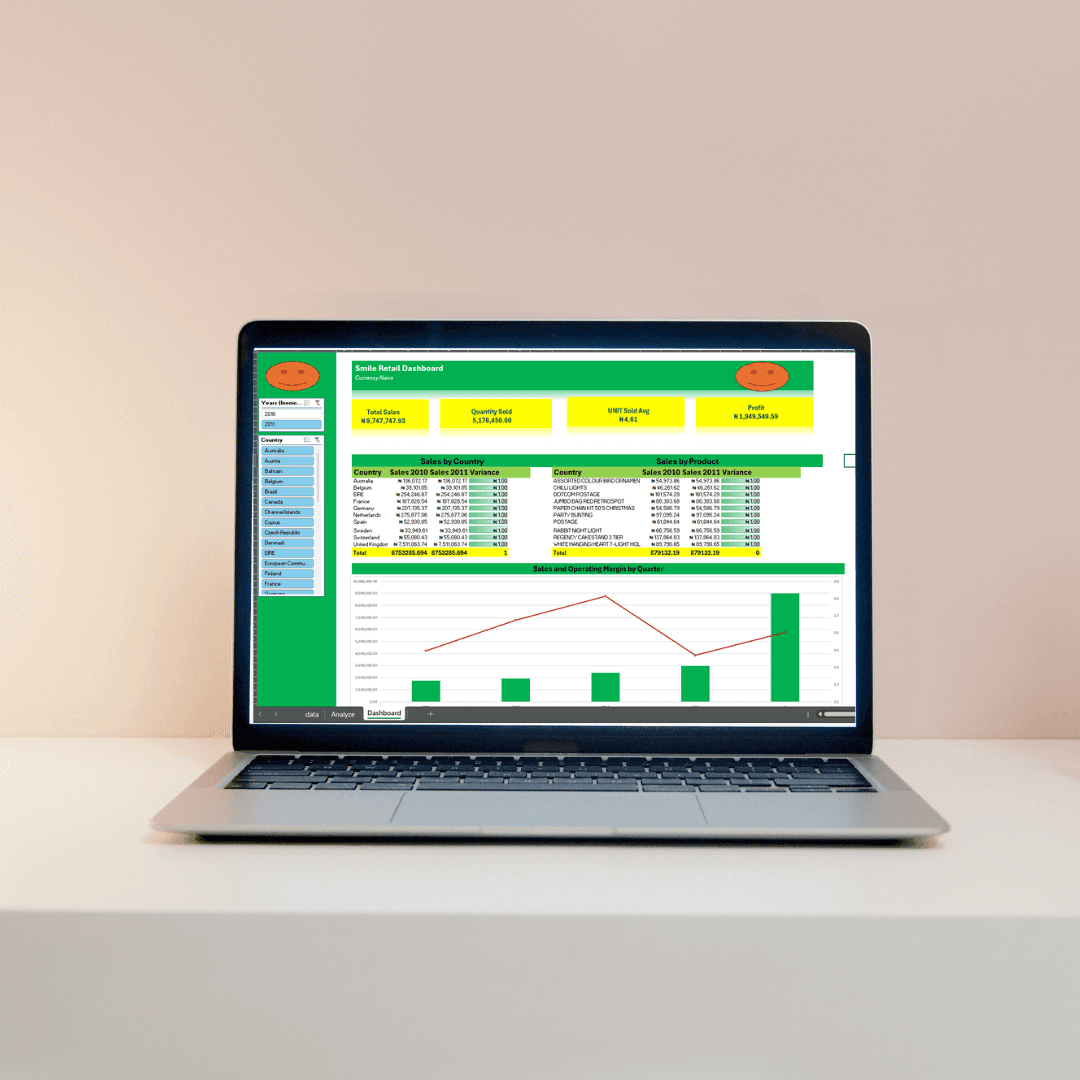
This Tableau-based dashboard visualizes the performance of a superstore across different regions in the United States. By mapping key metrics like revenue, quantity sold, and profit, the dashboard offers a clear, region-specific analysis, allowing stakeholders to quickly assess how different areas contribute to the store’s overall performance.
Project Overview
The dashboard provides a detailed breakdown of superstore performance across the West, East, Central, and South regions of the United States. Using geospatial mapping and bar charts, the visualization highlights the revenue generated, quantity of products sold, and profit margins in each region over a four-year period (2014-2017). This model allows for easy comparison of regional performance and helps identify areas of strong profitability and potential growth.
Key Features
Overall Metrics:
Total Revenue: $2,297.20K
Total Quantity Sold: 37,873 units
Total Profit: $286.40K These metrics provide a high-level summary of the store's financial performance across all regions.
Geospatial Mapping:
The dashboard includes three interactive U.S. maps, each displaying Revenue, Quantity Sold, and Profit by location. The geographic view enables users to visually grasp which areas are driving business performance.
Regional Breakdown:
West leads in all key metrics:
Revenue: $725.46K
Quantity Sold: 12.27K
Profit: $108.42K
East follows in all three categories, demonstrating steady performance.
Central region ranks third in Revenue and Quantity Sold but has the lowest profit, suggesting higher operational costs or lower profit margins.
South has the lowest revenue and sales, but ranks third in profit, possibly indicating efficient operations in this region.
Comparison by Region:
Bar charts at the bottom of the dashboard provide a visual comparison of the performance of the West, East, Central, and South regions, giving clear insight into how each region ranks in revenue, sales volume, and profitability.
Time Period:
The data spans from 2014 to 2017, allowing users to analyze trends and performance over multiple years.
Key Insight:
The West, East, and South regions are noted to be more profitable for the business, based on both revenue and profit metrics, while the Central region shows lower profit margins despite moderate sales volume.
Challenges and Solutions
Visualizing Profitability by Region: Displaying revenue, quantity sold, and profit on the same dashboard required careful balancing of different visual elements. The use of maps and bar charts helped to present complex data in a digestible format, making it easy for users to switch between different metrics.
Data Over Time: Presenting four years of data required optimization of filters and timelines to ensure that users could easily navigate between time periods without cluttering the dashboard.
Final Deliverables
Tableau Dashboard: A fully interactive Tableau dashboard that allows users to explore revenue, sales, and profit by region through geospatial maps and comparative bar charts.
Key Metrics Summary: Total revenue, quantity sold, and profit are summarized for quick insights at the top of the dashboard.
Regional Insights: Bar charts compare the performance of the West, East, Central, and South regions, providing a clear visual representation of regional differences in store performance.
Conclusion
This Tableau dashboard offers an insightful, interactive tool for analyzing superstore performance across various regions in the U.S. By visualizing revenue, sales, and profit data, it provides stakeholders with actionable insights into where the business is thriving and where there are opportunities for growth. The geographic and bar chart elements make it easy to compare regions and track performance over time, helping business leaders make informed decisions.
Tableau File Link: Download Here